Facebook Growth and Margin Warning Should Not Have Surprised Anyone

Shares of Facebook fell hard on Thursday after guiding investors to slower growth and falling operating margins going forward. Many FB bulls acted as this was a total shock (and obviously the stock was not reflecting the news either), but really this was bound to happen. In fact, FB had already warned that expenses would rise faster than revenue in 2018, to deal with all of the issues the company has been battling in the news lately. As a result, margin compression should not be surprising.

FB-1yr-july2018.png

Evidently investors also believed that even with 2 billion active users, the company could continue to grow revenue at 40%-plus. How that is possible when 2018 revenue will top $50 billion and user growth has slowed dramatically (there are only so many connected humans on the planet) is hard to understand. Perhaps investors see Amazon growing revenue 39% this past quarter and just assume that every high flying tech company can do the same. Amazon, however, is the exception, not the rule.

Below is a summary of Facebook's financial results, including some estimates I came up with for what 2018-2020 might look like. These are not all that different from the numbers I had been working off of for my last FB post earlier this year, but now that the company has publicly guided investors in that direction, it should be less of a speculation on my part.

FB-2018-2020.png

As you can see, GAAP free cash flow is unlikely to get much above $7 per share, even assuming the company can grow revenue by more than 100% over the next three years. Using my preferred measure, which includes stock-based compensation as though it was being paid out in cash to employees, free cash flow might struggle to get materially past $5 per share.

The big question for investors, then, is what multiple to put on such growth. The large cap tech leaders have been getting 30-40x multiples in recent years, but it is hard to know whether slowing growth rates (as these firms get so large) will crimp those valuations.

Facebook bulls would probably argue 30x that $7 figure is more than reasonable, and therefore would suggest a rebound to $210 per share (versus the current low 170's) is on the horizon over the next 6-12 months. Add back the company's cash hoard and maybe $225 is doable (the stock was already at $217 two days ago!).

More cautious investors might use 25x and prefer the $5 free cash flow figure, which would mean $125 per share, or $140 including FB's ~$40B of cash in the bank.

That leaves us with perhaps 20% downside and 30% upside depending on which camp you are in. Such a risk/reward does not exactly get me excited to build a position in the stock, but at least the shares are coming back to reality.

FB bulls are getting a good entry point and the bears have more reasons to watch from the sidelines. If I had to guess, I would give the bulls a slight edge and would not consider betting against the stock at current levels. In more specific terms, I think FB shares are more likely to see $200 again before breaking below $150 (the Cambridge Analytica bottom).

As Large Cap Tech Continues to Lead, Valuations Begin to Stretch

There is no doubt that the tech sector is where investors will find earnings growth in today's market, and many money managers are willing to pay full valuations to stack their portfolios with most, if not all, of the big name innovators.

Even though it means sometimes missing out on huge share price run-ups, I tend to buy these companies when they miss a quarter, during a market drop, or any other time when the valuations look "reasonable" (knowing full well they rarely will be cheap on an absolute basis). There was a great opportunity in Amazon (AMZN) in 2014, for instance. Last year, Alphabet (GOOG) in the low 900's looked like a good bet. Facebook (FB) briefly dipped below $150 earlier this year during a string of negative press, though I regrettably didn't pull the trigger on that one.

In fact, massive buying of these leading tech companies has resulted in the sector comprising 26% of the S&P 500 index, a level not seen since the peak of the dot-com bubble in March 2000 when tech accounted for a stunning 34% of its value. For comparison, financial stocks peaked at 20% of the S&P in 2007, before the housing collapse and no other sector has ever reached the 20% level. Amazingly, the five most valuable stocks in the index today are tech names:

Tech-Dom-SPX500.png

I have previously written about Amazon's recent share price ascent and how its price to revenue multiple is getting quite rich -- which has not stopped the stock from jumping 20% since -- and today I want to dig into Alphabet as well. While that stock around $900 last year looked like a solid GARP ("growth at a reasonable price") play last year, as it approaches $1,200 today I am a seller.

A big issue with these tech companies is their tendency to dole more and more stock, instead of cash, to employees as part of compensation packages. This allows them to produce inflated cash flow numbers, which investors/analysts then use to justify their investments/recommendations. When I value them, conversely, I use an adjusted free cash flow metric that subtracts from reported free cash flow all stock-based compensation. To me, this adjusted number more fully reflects how much cash the business is actually generating.

Below are some data points for Alphabet, from 2015 through 2018:

GOOG-Valuation.png

As you can see, stock-based compensation at Alphabet equates to roughly one-third of free cash flow. Therefore, when the investing community cites strong operating cash flow, or impressive free cash flow, they are ignoring billions in stock comp. To give you a feel for the magnitude of these numbers, my internal estimates indicate Alphabet's stock comp will come within striking distance of $10 billion in 2018. It is more than just rounding error.

Despite strong sales growth (the consensus view calls for 20% per year, on average, for 2018 and 2019), investors are paying quite a big price for the stock at current prices. At $1,180 each, GOOG fetches just shy of 50x times my 2018 free cash flow estimate, less stock-based comp, of $25 per share.

As an alternative, using EV/EBITDA, which includes stock comp and gives the company full credit for their large net cash position, the multiple is an unattractive 18x (using my 2018 EBITDA estimate of $41 billion).

While there will always be investors willing to pay up for growth, the main thesis in recent years ("the stocks are not expensive") might be harder to justify now. As a result, I think it is more important than ever to be opportunistic and focus on taking advantage of near-term pullbacks, rather than buying the biggest U.S. companies indiscriminately just because they have performed so well in recent years.

Full Disclosure: I have been selling shares of GOOG this week

Big Question Mark for Facebook: Profit Margins (Not Advertiser Behavior or User Engagement)

There has been a lot of commentary in recent days about how user engagement will change, if at all, in the wake of Facebook's user data privacy hiccups, as well as how advertisers will react and whether they will shift dollars to other social media platforms. I actually do not think either one of those metrics will materially change in the coming months. What is more important in my eyes is how Facebook's margin structure could be permanently different in 2018 and beyond.

Sure, there will be some users who stop using Facebook and blame the recent issues, but those users were probably not using the platform much to begin with, and as with most things, people tend to have a short memory. Diners typically return to restaurant chains even after illness outbreaks and shoppers did not abandon Target or Home Depot after massive credit card data breaches.

I also would not expect material advertiser migration. It reminds me of the NFL ratings drama over the last season or two of professional football. Television ratings have declined, in part due to an abundance of games (Monday, Thursday, Sunday), more viewing options that are not easily tracked by Nielsen (streaming services, mobile apps, etc), and more competition for eyeballs (Netflix, etc), but the NFL is quick to point out that despite lower ratings, NFL telecasts still get more viewers than most every other television program. As a result, if you want to allocate ad dollars to TV, the NFL will remain one of the best ways of doing so.

The same should be true with Facebook. If both the user base and the average time per day spent on the app drop a few percentage points, Facebook will not lose its spot as one of the best ways to reach consumers on social media.

The bigger question from an investor standpoint is what Facebook's margin structure looks like going forward. More specifically, how much expenses are going to rise and whether those costs are on-time or permanent. I suspect they will rise dramatically and will be permanent. After all, up until recently the company really just built the platform, turned it on, and let anybody do pretty much whatever they wanted with users and their data. It is obvious now that in order to maintain trust and their dominant position in the marketplace, they are going to have to [police the platform on an ongoing basis and limit the exposure to bad actors. This will cost money, lots of it, and will not bring in any incremental revenue. As a result, profit margins will fall and stay there, in my view.

This is critical for investors because the stock's massive run-up in recent years has been due to a growing user base leveraging a scalable cost base. Facebook's EBITDA margins grew from 48% in 2013 to 57% in 2017, and the stock price more than tripled. That margin expansion is likely to reverse beginning this year, to what extent remains unknown. Could those 9 points of margin leverage be recaptured by rising expenses of running the platform? I don't see why not.

In that scenario, investors may no longer be willing to pay 10-11x forward 12-month projected revenue for the stock, which has been the recent range. If that metric instead drops to 8x (~$149 per share), it will have implications for the stock (currently fetching $160) even if advertisers and users stay completely engaged with the platform.

Full Disclosure: No position in FB at the time of writing, but that may change at any time

Facebook Could Become Solid GARP Play If Near-Term Pressures Continue

Facebook (FB) stock debuted less than six years ago at $38 per share and went through two very distinct sentiment shifts. The current environment, as the company faces pressure from multiple sides to better control use of its massive platform, could very well mark yet another shift.

In May 2012, Facebook IPO'd and flooded the market with stock, so much so that anyone could buy shares at the offer price. Investors were skittish that the company could move quickly to capitalize on the move from desktop to mobile usage and the stock quickly fell into the teens. That turned out to be one of the best growth stock investment opportunities in recent memory, because back then very few people understood just how much money the company would earn in just a few short years.

For instance, what if you knew that Facebook would grow revenue from $5 billion in 2012 to $27.6 billion by 2016, and that free cash flow would go from negative to $4 per share that year? Well, the stock probably never would have traded under $20 and I would bet that investors would have gobbled up every IPO share they could at $38 each.

That was very reminiscent of the Google IPO, which many people thought was wildly overpriced, only to be shocked a few years later when the company's profits made the IPO price look like an enormous bargain (in hindsight only, of course).

As a result of huge profit growth, sentiment in Facebook has shifted dramatically in recent years and the stock had surged to $176 per share by the end of 2017, as free cash flow reached nearly $6 per share last year. While not overpriced necessarily, the bar has certainly been reset quite high, and therefore Facebook is more susceptible to near-term problems, such as how they are controlling the use of their user data and advertising platform.

FB-maxchart.png

The chart above shows the entire history of Facebook's public stock performance and therefore the recent decline barely registers as a blip. If we look at the last year, we see that the shares have largely been moving sideways, and the recent drop is only about 15% from the highs:

FB-1year.png

So are the shares getting close to an attractive level? It likely depends on two factors; what valuation methodology you use, and whether you think the company can continue to grow per-share cash flow, or if future growth will be hampered by user base maturation and increased costs associated with policing the platform more heavily.

My base case is that they grow, but at materially slower rates, and margins come down some but remain quite high. As far as valuation, I prefer to use free cash flow per share, but I deduct non-cash, stock-based compensation. That metric for 2017 came out to roughly $4.65 per share (versus $5.91 if you ignore SBC). My estimate for 2018 is roughly $6.50 per share, but I realize there is risk in this figure because we really don't know how much expenses are going to increase in the face of current political and social pressures.

For Facebook to get into the sweet spot as a GARP (growth at a reasonable price) investment, I would have to see a multiple of 20-25x free cash flow less stock-based compensation. On my 2018 estimates, it equates to $131-$164 per share. The current quote, after a 5% drop today, is $163 per share. In other words, FB stock is arguably now finding itself in GARP territory.

Given that near-term sentiment could very well accelerate to the downside, and considering that modeling 2018 growth rates of 35% in both revenue and free cash flow (the current consensus) are probably skewed to the aggressive end of the spectrum, I would probably want to pay less than the current price. However, if the stock reaches the midpoint of my 2018 range ($150-ish), it could very well make for a strong GARP investment from my vantage point.

Full Disclosure: No position in FB at the time of writing, but positions may change at any time 

Amazon Shares Pierce $1,430 And Sit Firmly Above 3x 2018 Forecasted Revenue

Valuing shares of Amazon (AMZN) has always been a difficult task since the company does not at all care about short-term profit margins. Investors are left with trying to estimate, based on the company's various businesses, how large each will get and what type of margins will likely be achieved once each reaches maturity.

Of course, such an approach becomes nearly impossible when you have no sense of which businesses Amazon will choose to enter over time (or maybe the better question is which they will "not" enter). Traditional retail was one thing, but now with cloud services and advertising revenue, margins are going to be all over the map.

I recently trimmed many of my clients' positions, as I have done once or twice since I made the investments beginning in 2014. My methodology has been inexact, to account for the aforementioned issues regarding Amazon's various ventures, but it generally involves looking at AMZN on a price-to-sales basis and then seeing what margin/multiple assumptions are baked into such valuations. For instance, if you think they will ultimately earn a 10% profit margin at maturity, you might be willing to pay 20 or 30 times normalized profits, which would equate to 2-3 times annual revenue.

Given the company's growth, my personal view is that anything up to 3x revenue is at least somewhat reasonable, as I don't see margins going above 10% given the company's desire to remain value-based in the eyes of consumers, and anything over 30x profits for a growth company makes me nervous. And if someone argued that they will never reach 10% margins and a 30x multiple is too high, I can totally understand that view. I just think some valuation flexibility is warranted given that Bezos might actually get as close as anyone in business to total world domination.

So below I have posted updated graphs that show Amazon's stock price over the last two decades or so (not very helpful when trying to evaluate the valuation), as well as their year-end price to trailing 12-month revenue ratio (far more helpful in doing so). Note: the 2018 data points are based on today's stock price and consensus 2018 sales estimates.

AMZNat1425.png

As you can see, AMZN stock hovered around the 2.0x price-to-sales ratio level between 2004 and 2014, with a range of 1.5x-2.5x or so. In recent years, as momentum stocks have led the market higher, that number has surpassed 3x and currently sits around 3.2x.

Given that position sizing in portfolios is always important to me, this graph tells me that now is not a bad time to trim AMZN. Trading above 3x revenue would seem to indicate that investor sentiment is quite high. There may be good reasons for that, of course, but as the company gets bigger and bigger, its growth rate is sure to slow. In fact, in order to grow by the 29% rate that Wall Street analysts are expecting in 2018, total sales need to rise by a stunning $51.5 billion. That very well might happen (and acquisitions like Whole Foods will only help), but when growth slows to only 10 or 15%, investors might not want to pay 3.2x revenue any longer. In my mind, anything above 3.0x tells me to tread carefully.

What do you all think? What kind of profit margins do you think AMZN will earn at maturity (i.e. when its growth rate is in-line with the average company)? What multiple of revenue seems right to you?

Full Disclosure: Long shares of Amazon at the time of writing (even after selling a chunk at $1,400 recently), but positions may change at any time

No Bitcoin Bubble Here: Pink Sheet Listed CRCW Market Cap Hits $10 Billion

If you were an active investor back in the late 1990's you probably remember what the climate was like during the dot-com bubble. All a company needed to do was issue a press release announcing they were going to launch a web site to sell their product online and their stock price would skyrocket. This CNET article on oldies music marketer K-Tel, which saw a 10x jump in share price in just a month back in 1998, offers a good refresher.

The current bubble in cryptocurrencies is worse, in my view, because unlike the Internet (which many will agree was the most important innovation of that generation) it is not clear that we really have any need for virtual coins, which like any collectible will see their value swing wildly based on what someone is willing to pay for them on any given day. Maybe I am just ignorant and will be proven wrong in coming years, but I don't see why a bitcoin is any different than a piece of art, a baseball card, or a beanie baby. They all have a finite supply and little or no intrinsic value.

If you need evidence of a bubble in bitcoins and the fact that the price has gone from $3 when I first heard about them in January 2012 (Featured on Season 3/Episode 13 of CBS's "The Good Wife" - streaming available for free on Amazon Prime Video) to $17,000 today is not enough, look no further than shares of The Crypto Company, an unlisted stock trading on the pink sheets under the symbol CRCW.

On November 15th, The Crypto Company announced financial results for the third quarter. There is no business here. Revenue came in at whopping $6,000 (consulting fees). Cash in the bank stood at $2.6 million, plus another $900,000 worth of cryptocurrencies.

How much is a company with a few million dollars of assets and no operating business worth? Well, the stock closed that day at $20, giving it a market value of $415 million (~20.7 million total shares outstanding).

But wait, that's not the crazy part.

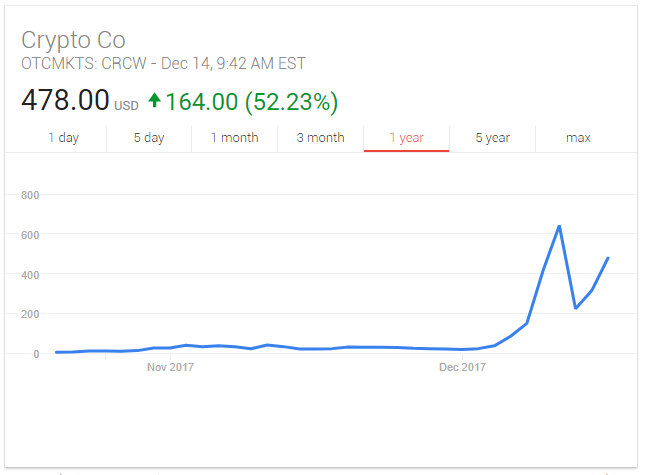
Shares of CRCW have surged nearly 24,000 percent in just 30 days since then, valuing the company at $10 billion. That is a bubble, folks. 

CRCW-478dollars.png

CenturyLink/Level 3 Merger: 1 + 1 = 1/2 ?

A year ago my local phone company, CenturyLink (CTL), announced a $34 billion deal to acquire Level 3 Communications (LVLT), one of the leading business communications carriers in the nation. The deal was widely seen as a way to preserve CTL's $2.16 per share annual dividend, coverage for which was coming under pressure as cable and streaming companies continue to take market share in the local consumer phone, video, and data markets. Combining with Level 3 would result in a larger player (competing nationally with AT&T and Verizon) with roughly 75% of revenue coming from business and wholesale customers.

Over the course of the 12 months it took for the two companies to close the deal, the consumer business continued to erode, and CTL's stock price fell from $28 to below $20 per share. Competitors like Frontier, which acquired a lot of Verizon's FIOS customers and proceeded to lose many of them, have investors fearful that the consumer business can never be repaired. Over the last month, CTL has fallen even more and today trades for $14 per share.

I happen to agree that competing with cable and streaming offerings is not a viable business model long term. CenturyLink is constantly going door to door here in Seattle peddling high speed internet. Despite general disdain for Comcast, their service is more reliable and similarly priced, so CTL really has no way of taking market share in the consumer market.

And that is why this Level 3 deal is so interesting, because the new company is 75% enterprise.  Investors and computerized algorithms treat Frontier and Windstream just like CenturyLink, even though the latter company just completed a transformational transaction that puts it in the top three corporate providers alongside AT&T and Verizon.

Perhaps the best part of the deal is the fact that Level 3 CEO Jeff Storey will take over as CEO of CenturyLink in 2019. Storey's focus on the business customer sheds light on the future direction of the company. His track record at Level 3 since joining in 2008 and being named CEO in 2013 has been superb (revenue doubled and free cash flow went from zero to over $1 billion a year). As an investor, it is refreshing to listen to him on quarterly earnings conference calls because he talks more about maximizing free cash flow per share than he does about TV and internet bundles. If there is a better CEO to integrate these two businesses, focus on the business client, and maximize cash flow for the owners of the business, I do not know of one.

CenturyLink's $2.16 per share annual dividend is on center stage as this new company begins to come together. Management has been firm in its desire to maintain the payout, but investors are looking past them. At $14 per share, the yield is a stunning 15%.On the face of things, it does appear that CTL can pay this dividend comfortably from cash flow, in addition to funding about $4 billion of annual cap-ex. Pro-forma free cash flow will likely come in around $1.5 billion in 2017. Add in $1 billion of expected cost synergies, and $600 million of annual cash tax savings (LVLT has nearly $10 billion of net operating loss carryforwards) and there is a clear path to $3 billion of annual free cash flow if management can keep the business stable (business growth offsetting consumer decline) over the next couple of years. In comparison, the current dividend amounts to about $2.3 billion annually.

It appears that Wall Street is set on painting CTL with the same brush as other regional carriers who have been unable to halt the decline in their consumer-led businesses, which has promoted repeated dividend cuts. To me, the dividend itself is relatively meaningless (stocks are valued based on profits, not dividends). Today CTL's equity is valued at roughly $15 billion, which would be 5x annual free cash flow post-synergies. Regardless of what their dividend payout ratio is, if Jeff Storey and Company can execute on the business and focus on their enterprise customers, it is reasonable to assume that CTL performs much more like a Verizon or AT&T than just another regional consumer-focused phone company.

CTL.png

With the stock price having been halved since the deal was announced a year ago, nobody seems to think that buying Level 3 changed CenturyLink's business outlook. And they also do not seem to care about Jeff Storey's track record of creating shareholder value (LVLT stock more tripled during his 5 years as CEO). In other words, the bar has been set immensely low.

Full Disclosure: Long shares of CTL as well as CTL debt securities at the time of writing, but positions may change at any time.

Another AMD Comeback: Stock Says Most Certainly Yes, But I'm Skeptical

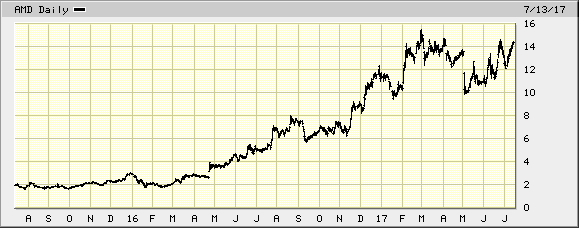
At first glance you might very well think Advanced Micro Devices (AMD) is having a hugely successful rebirth. Here is two-year chart of the semiconductor company's stock price:

AMD-2yr.png

After so many fits and starts and promises over the last few decades, with little to show for it in the way of sustainable profitability, I had not really looked closely at the shares, even during this huge run recently. Then I read an article in the July issue of Fortune that spotlighted AMD's bet on new chips that apparently has gotten investors' attention.

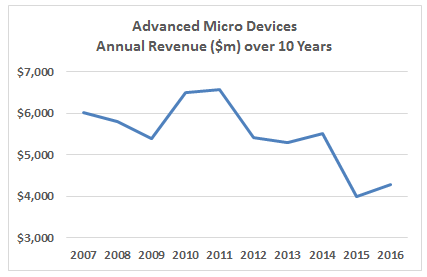
For a company whose annual revenue in 2015 and 2016 ($3.99 billion and $4.27 billion, respectively) were the lowest out of any of the past ten years, AMD's current market value of $13.5 billion (today's share price: $14.39) seemed pretty lofty, but I wanted to dig deeper to see if progress is really being made. The numbers are pretty ugly…

The aforementioned revenue trend is poor:

amd-10yr-rev.png

And profitability is hard to come by. Here is free cash flow over the last decade:

amd-10yr-fcf.png

Okay, "hard to come by" might be overly generous... AMD has not turned a material cash profit, after required capital expenditures, in any of the past 10 years. Looking at the two-year stock price chart again, it is hard to understand why the share are trading above $14 each.

Evidently, optimism about future products is high, despite some clear setbacks as noted in the Fortune piece. But I suspect the stock may be ahead of those rosy expectations. Including half a billion dollars of net debt, investors are currently valuing AMD at $14 billion. Revenue is expected to reach $5.3 billion in 2018 (sell side consensus estimate), which would get the company back to 2012-2014 sales levels.

So what is a best case for AMD? I decided to try and pinpoint a number in order to draw a final conclusion about the current stock market valuation. To do this I like to assume that most metrics get back to previous peak levels and see what kind of stock price I would get if things go right from here. Call it the "bull case" as many analysts do.

Using the last decade as my data set, I see that gross margins peaked in 2010 at 46%. R&D spending troughed at 19% in 2014. Corporate overhead troughed at 11% last year. Let's plug in those expense levels (equating to EBITDA margins of 16%) and further assume that AMD can get annual revenue back to $6 billion (40% above 2016 levels and 12.5% above consensus estimates for next year). In that scenario annual EBITDA would come in at $960 million. Let's call it a billion.

What multiple should we use on that $1 billion of EBITDA? Industry behemoth (and the competitor AMD has never been able to strongly challenge), Intel, trades at 7 times. If we give AMD the same valuation the equity would be worth $6.5 billion, or roughly $7 per share. Even if we are generous and assign a 10x EV/EBITDA multiple, we only get to $10 per share.

At over $14 per share, AMD stock currently reflects very optimistic assumptions about the company's future growth, profitability, and valuation ($1.4 billion in annual EBITDA, at a 10 multiple, for instance). If the last decade is any indication, the odds are not great that they deliver. As a result, I am not touching the stock. In fact, for those who short overvalued and underwhelming businesses, it might be a solid candidate.

Full Disclosure: No position in AMD at the time of writing, but positions may change at any time

Buffett Sells IBM, Jumps On Apple Bandwagon - Blessing Or Curse?

Warren Buffett's decision to invest a large sum in Apple (AAPL) in recent quarters was so surprising because he once regarded tech companies to be outside his so-called "circle of competence." Then six years ago he started buying IBM (IBM) shares, which only served to confirm that the legendary investor indeed should probably steer clear of the sector and focus on the areas of the economy he knows best.

In recent days we have learned that Buffett has begun selling off his IBM position (about 1/3 thus far), but his new tech favorite is clearly Apple, which he has been accumulating so much that it now represents his second largest single stock investment in dollar terms behind Wells Fargo (WFC).

His timing with Apple appears to have been quite good, although I suspect that is more due to luck than anything. For the last year or so, Apple bulls (other than Buffett) have been touting the idea that the company is not actually a hardware company, but rather a software and services company with valuable recurring revenue. It should follow, they say, that Apple stock deserves a much higher earnings multiple than it traditionally has received (below the S&P 500 due to the perceived fickle nature of technology products, especially on the hardware side of the business).

I am not convinced that this argument makes sense, at least yet. Every quarter we hear investors tripping over themselves about Apple's service revenue growth, and yet whenever I look at the numbers I still see a hardware company. Consider the first half of Apple's current fiscal year (which ends September 30th). Service revenue made up 11% of Apple's total sales, versus 67% for the iPhone, 10% for the Mac, 7% for the iPad, and 5% everything else. Clearly, Apple is not a software company.

Now I know that services have higher margins, so although they represent 11% of sales, they contribute more than that to profits, which is a good thing. But in order for software and services to really become a large contributor to Apple's bottom line, the revenue contribution has to rise materially, in my view. And that is where I think the "Apple is a services juggernaut" thesis gets shaky.

Over the last six months, services made up 11% of total revenue. Okay, so clearly that number must be accelerating pretty quickly given how bullish certain shareholders are about Apple's earnings multiple expansion potential, right? Well, in fiscal 2016 the figure was also 11%. In fiscal 2014 it was 10%. In fiscal 2013 it was 9%. Services thus far are not growing much faster than hardware, which actually makes sense when you think about the Apple ecosystem.

If you want more people to buy the services, they have to buy the hardware first. So maybe the two go hand in hand. Put another way, if many iPhone owners have not subscribed to Apple's services yet, why would they suddenly begin to adopt them at higher rates in the future? At least, that is the argument for why services might not become 20 or 30% of sales over the next few years.

Interestingly, since Buffett started buying more Apple, the earnings multiple has increased. Much of that likely has to do with the prospect for corporate tax reform and the potential for the company to repatriate their large cash hoard ($30 per share net of debt) back home at a low tax rate, but some probably is linked to the idea that services are about to explode to the upside. Color me skeptical on that front.

Year-to-date Apple shares have rallied from ~$116 to ~$152 each. On a free cash flow basis, the multiple on fiscal 2016 results has risen from 12x to nearly 16x. As a holder of the stock, I am certainly happy about that, but I wonder how much more room the multiple has to rise. And will it turn back the other way if services growth disappoints or if tax reform is less aggressive than hoped? Perhaps.

If that happens, the stock price could very much depend more on Apple's future product lineup than anything. On that front, I am nervous about the company. In recent months I have come to the conclusion that Amazon (AMZN) might be the "new Apple" in terms of tech innovation. Not too long ago it was Apple that would be first to market (the iPad, the iPhone, etc), and then everyone else would copy them (and fail). Lately it seems that Amazon has taken over that role and Google (GOOG), Microsoft (MSFT), and Apple then copy them.

I am thinking about Amazon Echo, which Google quickly copied and rumors are that Apple is not far behind in doing the same. With Amazon's announcement this week about Echo Show I had the same thought. Dash buttons - same thing. Drone delivery - same thing. Apple is reportedly funding original TV shows and movies now (years behind the curve). The Apple Watch wasn't first to market, etc. Oh, and the attempt to build an electric car in Cupertino? The perfect example of mimicry.

If that is the case, then Apple's hardware growth, which has been halted, may be difficult to accelerate. And if services need to pick up the slack, there is a lot of work left there as they seem to be stuck as a percentage of total sales.

While I am not bearish on Apple as an investment - their ability to generate cash remains more than formidable - with the recent earnings multiple expansion I am starting to think about where future upside will come from. If the most exuberant bulls are right and the stock can garner a multiple a la Coca Cola (KO) or McDonalds (MCD) (20-25x earnings), that is definitely the answer. I am just not sure sure that makes sense, at this point anyway.

Full Disclosure: Long shares of Apple and Amazon at the time of writing, but positions may change at any time