Why Elon Musk's Public Company Stocks Are A Tough Sell - Even At A Large Discount

I fully expect to be asked a lot about SpaceX (SPCX) stock in the coming days and weeks, given that the shares are now trading 50% below the peak ($225) set on the third trading day post-IPO last month. Trading under both the issue price ($135) and the first trade ($150) must present a great buying opportunity, right? Honestly, who knows?

As someone who tries to quantitively value the companies he invests in, I don’t see much “value” even now. After all, the market cap is still sky-high at $1.5 trillion. For comparison, SpaceX completed multiple fundraising rounds in the last year at far lower prices ($400 billion in July 2025, $800 billion in December 2025, and $1.25 trillion in February 2026). So while $1.5 trillion looks low compared with the peak of $3.0 trillion, is it obvious that the company is worth materially more than 2x the December 2025 or 4x the July 2025 figures? Or is it more likely that people were just tripping over themselves to get a piece of the action at each successive opportunity?

We often hear that Musk’s companies (especially the public ones) have cult followings, and I think that is true, even to the extent that the public market valuations never quite make sense. Of course, that does not mean the stocks won’t perform far better than the underlying fundamentals (Tesla’s has, enormously), it just means that there is more long-term risk involved. I think Tesla is a helpful example, as the company has been public since 2010, and I expect SpaceX to see similar shareholder loyalty.

Tesla’s public market history is truly remarkable. Adjusted for two stock splits, the company first sold shares in mid 2010 at $1.13 each (the first day closing price was $1.59). Since then the stock has rocketed 288-fold to the current $325 price. Annual revenue during that time has ballooned from $117 million in 2010 to $94.8 billion in 2025 (an 810-fold increase).

So you might be thinking, “what’s the issue?” For equity investors, profits are what tend to matter most long-term, and on that metric, Tesla’s history is less impressive relative to its current market cap. Between 2010 and 2025, cumulative free cash flow is roughly $21.5 billion. Cumulative stock-based compensation is roughly $15.0 billion, leaving about $6.5 billion of cumulative profits available for equity holders over a 16-year period. We can really only judge that figure relative to the current market cap, which is $1.15 trillion. Simply put, today Tesla stock trades for a stunning 177 times trailing cumulative 16-year adjusted free cash flow.

Okay, fine, but what about current performance? Surely cumulative 16-year profitability is less relevant going forward, right? I would agree. However, in 2025 Tesla earned adjusted free cash flow of just $3.4 billion. That puts the current valuation at 338 times annual free cash flow. Even if we take the company’s best year ever ($6.0 billion earned in 2022), the multiple is still a whopping 191x.

Similar trends seem to happening with SpaceX now that it is a public company. At the average analyst estimate for 2027 revenue of $73 billion (profits are years away), even after a 50% decline, SPCX trades for 20x revenue. Let’s imagine that overnight the company becomes profitable, with margins equal to Tesla’s best year ever (15%). The stock would still fetch over 130 times next year’s earnings.

Let me be clear, extreme valuation does not (in and of itself) mean that SpaceX stock will keep falling from here. In fact, short-term sentiment is quite extreme and could be due to reverse on any good news. However, when a company goes public with a market value of up to $3 trillion, the bar is set immensely high for buyers at that price to earn superior returns in the future.

Comparisons will always be made to Tesla’s stunning post-IPO performance, but keep in mind that Tesla’s first day closing valuation was less than $1 billion. There was a lot of upside potential at that level. SpaceX has a harder hill to climb being valued 2,000 times higher today.

Lastly, you may be wondering if there a price that I would buy SpaceX stock? Honestly, I’m not sure, simply because there are a lot of businesses contained in it that I don’t find particularly exciting (Twitter, data centers in space, etc). But for those true believers in the underlying business long-term, sure, there is a price where the risk is vastly reduced. Personally, 15x revenues would probably be the most I would consider reasonable if I was in that camp. The current projections for 2027 revenue are very wide, as nobody really has a clue what the number will be. But here is the breakdown; at the $73 billion mean estimate (15x sales = $84 per share), and at the $85 billion high end estimate (15x sales = $98 per share). Who knows, if it drops below $100 maybe I will buy some just for fun. :)

Full Disclosure: I have no personal position in either Tesla or SpaceX, long or short, at the time of writing but that could always change in the future without further notice.

Airbnb Stock Today: 10% Below First Day Closing Price in December 2020 IPO

I know it might sound silly these days, but I am of the belief that non-AI stocks can make investors money too. I am quite surprised that Airbnb (ABNB) stock has gone nowhere for more than four years since its IPO. Does this company’s business model and long-term outlook justify a close look at the current $130 price? I tend to think so and plan to start buying some shares soon.


U.S. Stock Market Value Concentration Now Narrowest On Record

Do you remember the first time a U.S. listed company reached a market value of $1 trillion? If it doesn’t seem like that milestone was achieved that long ago, that’s because it’s only been six years (Apple, in the summer of 2018). The tech giant at that point comprised about 4% of the S&P 500 index’s total value. A nice chunk for sure, but hardly astonishing or potentially problematic.

Fast forward to mid-2024 and the value concentration has gotten far more narrow. We now have three companies (Apple, along with Microsoft and NVIDIA) that carry market values of more than $3 trillion each. The trio together comprise more than 20% of the S&P 500 index’s market value. Think about that… 0.6% of the stocks comprise more than 20% of the value. It truly is the most concentrated market we’ve ever seen.

Market technicians often monitor overall breadth closely to try and gauge general market conditions, but since I am a more fundamental investor I don’t have much in the way of statistics to share on that front. What I have noticed, though, is that the bulk of the U.S. stock market has stagnated.

Consider the Russell 3000 index (which comprises about 90% of all major exchange listed U.S. stocks) and its offshoots; the Russell 2000 (smallest 2,000) and Russell 1000 (largest 1,000). As of yesterday’s close, on a year-to-date basis, the Russell 2000 was unchanged for the year, whereas the Russell 1000 was up 14%. If we distinguish between the market-cap weighted S&P 500 index and the equal-weighted version, we see a similar pattern (cap-weighted up 15%, equal-weighted up 5%.

Narrow breadth in and of itself, while not a great sign, doesn’t concern me too much. The bigger issue I see is the euphoria surrounding a very narrow group of stocks. When my golfing buddies and young relatives (neither having showed any interest in the market before) are all talking about buying NVIDIA, all it does is remind me of other moments of maximum stock market bullishness… and how they rarely last.

Big Tech Valuations Are Greatly Skewing the S&P 500's Overall Valuation

With the benchmark 10-year government bond rate now yielding around 5% it can be a bit disheartening for equity investors to see the S&P 500 fetching about 19 times earnings. At best, future upside in price is likely going to need to come from profit growth, not multiple expansion. And if a recession materializes in 2024, prompting a material decline in multiples, well, look out below.

That’s the bad news.

The good news is that the big tech sector has grown to be such a large portion of the overall market that non-tech stocks actually aren’t richly priced at all, even in the current interest rate environment.

Consider the 7 largest tech stocks in the market - Apple, Microsoft, Amazon, Alphabet, Nvidia, Tesla, and Meta Platforms. Together they comprise 28% of the market cap weighted S&P 500 and sport a blended P/E ratio of 37x. Some simple algebra tells us that the rest of the market (the remaining 72%) carries a blended P/E ratio of just 12x. That latter figure makes sense considering stocks generally are well off of their all-time highs and rate increases have clearly been a headwind over the last 24 months or so.

The analysis remains consistent if we expand the calculation to include more of the tech sector. Information technology alone (excluding communications services - which is a separate S&P sector designation) comprises about 27% of the cap-weighted S&P 500 and sports a 29x P/E ratio. Doing the same number crunching shows that the remaining 10 sectors of the index combined carry a P/E ratio of just 16x.

If we try to determine what “fair value” is for the U.S. equity market given the 5% 10-year bond rate, most market pundits would probably say somewhere in the “mid teens” (on a P/E basis) based on historical data. In that scenario, 19x for the entire S&P 500 seems high, until we consider that tech stocks account for the elevated level overall. Exclude tech and (depending on your preferred methodology) everything else trades for a low to mid double-digit earnings multiple - which certainly makes it easier to sleep at night. It also likely explains why there are no shortage of attractively priced stocks outside of the high flying tech names that most people focus on. That’s probably the best place to focus right now as a result.

Will Amazon's Efficiency Push Finally Prove That E-Commerce Is A Good Business?

Last year, for the first time since I originally started to invest in Amazon (AMZN) stock back in 2014, my own sum-of-the-parts (SOTP) valuation exceeded the market price of the shares. If you are wondering why I owned it at any point when that was not the case, well, the company’s growth rate was high enough that I would not have expected it to trade below my SOTP figure - which is based solely on current financial results.

That discount got my attention, as Amazon took a drubbing in 2022 like most high-flying growth companies in the tech space coming off a wind-at-their-backs pandemic. What is most striking is just how much of Amazon’s value sits in its cloud-computing division, AWS. If one takes a moment to strip that out (everybody knows it’s insanely profitable and a complete spin-off in the future would be an enormously bullish catalyst for the stock) and focus on the e-commerce business by itself, the picture becomes a bit murky. More specifically, is that part a good business or not?

We have heard for many years - since the company’s IPO in fact - that management is focused on long-term free cash flow generation and thus does not shy away from reinvesting most/all of its profits in the near-term. But one has to wonder, at what point is “the long-term” finally upon us?

Amazon began breaking out AWS in its financial statements back in 2013, so we now have a full decade’s worth of data to judge how the e-commerce side is coming along. The verdict? Not great actually. Between 2013 and 2022, AMZN’s e-commerce operation had negative operating margins 30% of the time (2014, 2017, and 2022) and in the seven years it made money, those margins never reached 3% of sales. As you might have guessed, they peaked during 2020 at the height of the pandemic at 2.7%.

Now, do low operating margins automatically equate to a poor business? Probably not. Costco (COST), after all, has operating margins only a bit better. The difference is that Costco is a model of consistency and grows margins slowly over time, which indicates just how strong their leadership position is within retail.

For fiscal 2022, COST booked 3.4% margins, up from 2.8% in 2012. During that time they only dropped year-over year one time and even then it was only a 0.1% decline. Compare that with Amazon, which had margins of 0.1% in 2013, negative 2.4% in 2022, and year-over-year margin declines in five of the past ten years. Costco appears to be the better business.

Like many tech businesses that loaded up on employees and infrastructure during the pandemic, only to see demand wane and excess capacity sit idle, Amazon CEO Andy Jassy is focusing 2023 on operating efficiency. They are in the process of laying off extra workers and subleasing office and warehouse space they no longer need.

I think Amazon has a real opportunity to prove to investors that its e-commerce business actually is a good one that should be owned long-term in the public markets. If the company takes this efficiency push seriously, it could come out of the process with an operation that going forward is able to produce consistent profits and a growing margin profile over time with far less volatility than in the past. If that happens, I suspect the stock rallies nicely in the coming years.

If they don’t hit that level of clarity and predictability, but settle back into the old habit of ignoring near-term results and preaching the long-term narrative, I am not sure investors will have much patience. After all, Amazon has now been a public company for more than 25 years and the market wants to finally see the fruits of all that labor pay off on no uncertain terms for more than a few quarters at a time.

Full Disclosure: At the time of writing the author was long shares of AMZN (current price $102) and COST (current price $491) both personally and on behalf of portfolio management clients, but positions may change at any time.

Snowflake: Don't Let The Insane Stock-Based Compensation Fool You

The stark contrast between tech stock valuations in 2022 vs 2021 has been a welcomed development for those of us in the camp that is quite sensitive to earnings multiples when making investment decisions. As share prices across the sector started to collapse I was eager to step in for long-term holding periods even though I knew the bottom would likely be below my initial entry point. Now that the shakeout has occurred, there are many bargains, but not everything is cheap.

I was struck by an interview on CNBC yesterday with Brad Gerstner, who runs a tech-focused hedge fund called Altimeter Capital. Brad has been super bullish on Snowflake (SNOW) since the IPO given the company’s strong competitive position in a fast growing market. What I found odd was that as the market shifted away from the idea that almost any price can be paid for the best growth, Altimeter didn’t shift its positioning. SNOW was the fund’s largest holding when it reached $400 in 2021 and traded for 100 times sales and it remains so today with the shares at $150 (a meager 28 times sales).

During the same interview Gerstner made the compelling argument that in a highly inflationary economic climate with rising interest rates the market will not reward companies that seek growth over profitability any longer. Oddly, he then turned right around and pounded the table on SNOW because the valuation has compressed so much (from insane, to just extremely rich, I might add).

He repeatedly pointed to SNOW’s free cash flow growth, which he expects to double from $350 million in 2022 to $700 million in 2023. That would seem to imply that SNOW is indeed one of the tech firms that has pivoted from growth to profitability and thus may deserve a high sales multiple due to high profit margins. The problem is that SNOW’s income statement is littered with red ink. Take a look at their financial results from the first three quarters of 2022:

No, you are not misreading that income statement. So far this year SNOW’s revenue has grown by more than 75% and its net loss increased. Pre-tax profit margins are negative 41%.

So how on earth is SNOW reporting positive free cash flow, to the tune of hundreds of millions annually, when in reality it is bleeding red ink on the books? Well, they have learned that the key to getting their large investors to buy into crazy valuations is to generate cash even when you have accounting losses. And the only way to do that is to pay the vast majority of your compensation in stock and not cash.

Here is SNOW’s stock-based comp figure for the first 9 months of 2022:

$633 million! That equates to 40% of total operating expenses! No wonder it’s so easy for a large investor in your company to go on television and rave about your free cash flow generation. You are excluding 40% of your expenses from the equation!

Now, let me be clear. Snowflake’s market position is very strong; nobody is refuting that. This funding strategy says nothing about the company, other than how it is doling out shares and then ignoring that fact when it discussed profitability. The company is not profitable today, which makes a near-30x sales multiple look silly.

That said, they will make money at some point. With gross margins rising and approaching 70% right now, the business could easily earn 20% net margins in the future once they get their cost base in-line with other more mature software firms. Those future margins could command a valuation above the market overall (a 30x P/E with 20% margins implies a 6x sales multiple).

Bur the reality today is that the company is growing without any regard to expenses and the only way it is worth this price is if everything goes wonderfully for the next 5-10 years. Many believe that will happen. Gerstner claimed in his interview that SNOW will grow free cash flow 50% annually for many years and that the valuation will stay where it is today - for a total stock return of 50% annually over the same period. Neither of those seem like reasonable hurdles to clear in my eyes, but we’ll have to see how it plays out.

Bottom line: don’t get fooled into thinking that in tech land “free cash flow = profitability.” Normally it does, but not when you use stock-based compensation to a degree never seen in prior economic cycles (not even in Silicon Valley). And for investment managers who don’t hesitate to make their largest position something fetching 100 times revenue, ask yourself if that’s is what history says is a wise move financially, or if more likely that was what their investor base at the time wanted - and thus they had to figure out a way to justify doing it. Why they are still sticking to their guns is a question I can’t answer.

Is It Time To Swipe Right On Match Group Stock?

A little over two years ago, IAC completed a full spin-off of its interest in dating app giant Match Group (MTCH) with the stock around $100 per share and a ~$30 billion equity value (a partial spin was consummated in 2015). As a holder of IAC at the time, I felt MTCH was priced fully and sold the MTCH shortly thereafter.

Lately though the stock has been trading extremely weakly as revenue growth slows down (Tinder and other apps are reaching a more mature state). Match’s stock chart looks more like a profitless tech stock in the current market environment, but in reality this is a really “GARPy” situation because MTCH generates prolific free cash flow and has ever since it started trading on its own in 2015.

At the current $59 price, the equity is valued at about $17 billion with annual free cash flow of $800-$900 million, which means it trades at a market discount on that metric. Given their dominant position in the dating space, this company doesn’t need to trade based on revenue growth to work very well for investors. I expect robust share buybacks and strategic M&A to aid in growing per-share cash flow and earnings for many years to come and it appears the current sell-off is letting new holders get in at a very good price if they are so inclined. Count me as part of that group.

Full Disclosure: Long shares of MTCH at the time of writing, but positions may change at any time

It's Official: Tech Bubble 2.0 Has Burst

Economic bubbles are inevitable, much like the business cycle, but history shows they oftentimes don’t repeat in exactly the same way. For instance, I don’t think it’s likely we see another real estate bubble inflated by interest-only, pick-your-payment, or no-doc income loans, but there are other ways for property values to go bonkers. I would have said the same thing about the late 1990’s dot-com bubble, and I would have been wrong.

Those of us who remember that time period recall that profitless companies with little more than a lackluster business model saw share prices surge just by issuing an “internet-related” press release. We were told the market opportunity was so big that the current iteration of the product or service didn’t matter, let alone the valuation of the company. Businesses with real revenue were losing money but since the market opportunity was so large, we could try and justify paying 20 times sales instead of 20 times earnings. The big cap stocks back then played out a little differently, with stocks like Cisco and JDS Uniphase fetching more than 100 times earnings (compared with 25-40 times for Apple, Microsoft, and Google this cycle).

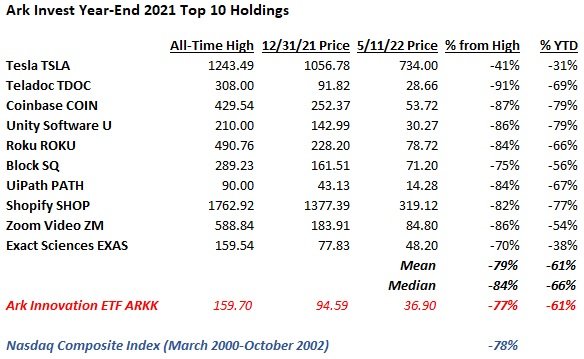
The rise and subsequent fall of Ark Invest’s flagship Innovation ETF (ARKK), special purpose acquisition companies (SPACs) targeting story stocks with a path to revenue five years out, and another general IPO boom (why is Allbirds public?) have largely mirrored the environment from 20+ years ago. We have fancy new terms (large market opportunity replaced with “TAM,” dot-com replaced with “innovation”) but the end result was nearly identical; profitless companies trading for insane valuations based on a dream of every good story becoming the next Amazon.

Exactly how close have we come to those olden days? Well, from the March 2000 peak (5,132) to the bottom in October 2002 (1,108), the Nasdaq Composite index fell by 78%. Take a look at the average decline for Ark Invest’s top 10 holdings (as of year-end 2021) from their peak:

Talk about deja vu.

Will the Nasdaq fall 78% again this time around? I doubt it because the biggest constituents today include many of the aforementioned names that are richly valued but never got to bubble territory. They alone should prop up the index in relative terms. As of today the Nasdaq is down 30% from the November 2021 peak. I think it’s more likely than not that the index doesn’t even get to minus 50% because of the mega caps.

Regardless, should we be worried? Well, no doubt the short term pain has been brutal. Although I didn’t chase the “innovation” highfliers shown above, I have been adding to my tech exposure as prices drop and have lots of red ink to show for it now. But I think the longer term outlook is pretty darn good for the highest quality businesses.

Why? Well, we are starting to see certain companies begin to acknowledge that the bubble is over and pivot towards cutting back on hiring and overall spending in order to turn operating losses into profits. They realize that showing revenue growth is not going to work for Wall Street anymore so margins have likely troughed for this cycle. The Uber CEO was recently very explicit that this is the route they are now taking and while the stock hasn’t reacted yet, I think they will prove to be a long-term winner and quite profitable over the intermediate term.

Not every company will go this route right away and they will find it hard to raise more money to keep the cycle going. They missed the chance to raise $5 billion at a $50 billion valuation - 10% dilution looks paltry now - and they will get an earful if they try to raise the same amount with a $10 billion valuation. But give it 6 or 12 months and I think most will come around to the idea that even innovative companies need to breakeven or make a little money.

I also expect the new environment will accelerate M&A activity. Bigger firms can bulk up and take out one of the many new competitors (do we really need so many SAAS companies or EV manufacturers?) and the cost synergies that come with a deal will also accelerate the margin expansion that investors now crave. I would not have guessed that Twitter would be the first big deal to get announced (and it’s a bit of a unique circumstance), but more deals should follow after everyone catches their breadth and the public markets stabilize a bit.

As for how I am approaching the current environment, I am fairly unconcerned if shares move against me right away (I’m not going to catch the bottom - I just want my cost basis to look solid 2-3 years from now). Many stock prices will look silly in the near-term if you believe they will emerge as leaders (Uber at half the IPO price despite the company having doubled revenue since then and having committed now to moving towards profitability?) but I am focused on trying to buy the winners cheaply regardless of what the next 3-6 months bring.

The current market reminds me of the Warren Buffett line that he wouldn’t care if the market closed for a few years. If you see a company you like for the long-term and the valuation finally looks compelling, I can’t help but suggest that maybe you buy it and put it away for 3-5 years rather than try and make sense of the near-term outlook and/or dynamics.

Full Disclosure: Long UBER at the time of writing but positions may change at any time

A Tech Bubble Basket To Monitor

As promised in my last post, below you will find what I am calling a “bubble basket” of tech stocks I have been taking a look at to varying degrees. The Russia/Ukraine situation is taking center stage in the markets these days, but I can’t really add much insight into the geopolitical landscape. From a stock perspective, the most I can offer is that maybe trimming energy exposure, if you have a nice chunk of it, would be an opportunistic move into the current rally. What I find far more intriguing from a long-term contrarian investing standpoint is sifting through the carnage in tech-land.

The dozen companies shown here range from small cap (Redfin and Vimeo) all the way to mega cap (Amazon and Facebook/Meta) and cumulatively have lost more than half of their value from the peak. Doesn’t mean they are all automatic buys just because of a large decline from bubbly levels, but it highlights the pain that has been sustained. Surely there are opportunities here, much like in 2000-2002.

You will notice I highlight price-to-sales ratios (PSR) instead of price-to-earnings (PE). I think it makes for a more apples-to-apples comparison when you have companies at different life stages. I am not fundamentally opposed to a growth company employing the Amazon “reinvest every dollar that comes in” approach - even if it cannot possibly work for everyone - and so if you believe in certain businesses long term regardless of current profitability, using the PSR can help you weed out the “priced to perfection” crowd (e.g. 20x sales).

Even still, the PSR is not a shortcut method. An e-commerce play has a different margin profile than a software company and thus the sales multiple should reflect that. I think the key is finding a mismatch where the multiple implies low profit margins at maturity but the business positioning could indicate otherwise. As an example, we see Uber at 2.5x sales and Chewy at 2.1x. One could argue that gap should be wider.

Anyway, I just wanted to share a list I have been working off of lately. I suspect the basket itself will do well over the next few years given the depressed prices. Picking the relative winners and losers is a trickier task, but one that might be well worth digging into.

As Bubble Tech Rightfully Corrects, What Looks Good and What Doesn't?

“This time” is never different. The last few years in techland reminded many of us of the late 1990’s bubble. Sure, not every detail is identical. Back then the mega caps traded at crazy prices too (the Cisco’s of the world at >100 times earnings) but this time 25-30x for Apple, Microsoft, Google, or Facebook might be on the rich side, but not grossly overvalued. And just as last time we had Amerindo, Van Wagoner, and Navallier, now we have seen history repeat with ARK Invest.

Just as was the case 20 years ago, there will be great buying opportunities during this valuation reset. Netflix down 50%? Interesting. Amazon down 25%? Interesting.

I will share a list of tech that doesn’t look expensive anymore in the coming weeks (think: low to mid single digit price-to-sales ratios), but first let’s consider what kinds of situations still look frothy even after big declines. 15x sales isn’t attractive just because it was 30x six months ago. Current profits (or at least a clear path to get there within 1-2 years) are important.

Let me share one example where the price still looks silly; DoorDash (DASH) at a $40B valuation. Sure, it was $90B at the peak. All that tells us is how crazy things got. On the face of it, the pandemic should have instantaneously made DASH a blue chip name in the tech space that was raking in money. Other than maybe Zoom, which “pandemic play” would you have rather owned on fundamentals alone?

However, the numbers tell a different story. I think they illustrate the problem with the current Silicon Valley mentality of favoring TAM rather than profit margins when it comes to investing in the public markets. Every management team says they are mimicking the “Amazon model” but Amazon was never hemorrhaging money. They wrote the book on running the business at breakeven and reinvesting every penny generated back into the business. There is a big difference between flushing capital down the toilet and running at breakeven to try and maximize future free cash flow.

Here is how DASH’s financials have evolved as the largest food delivery service during the best possible operating environment imaginable:

DASH lost $875 million in the 24 months immediately preceding Covid and then proceeded to lose $774 million in the first 21 months since. As an investor, why own this?

There are people who believe there is a high conviction path to this business turning those losses into a billion dollar annual profit. Possible? Sure. Essentially a done deal? Hardly. It will be difficult. And the price today, even after a near-60% stock price drop, implies a 40x multiple on that billion dollars. Yikes.

Simply put, many of these businesses will make their customers smile. The trick is to figure out how to make the income statement smile too. Amazon figured it out. Many of their followers won’t be able to.