Canada Goose: Brings Back Memories Of Other Fashion Stock Heydays

In the spirit of fashion, let me begin this article off with a runway of sorts, even if it is a lineup of stock charts rather than models.

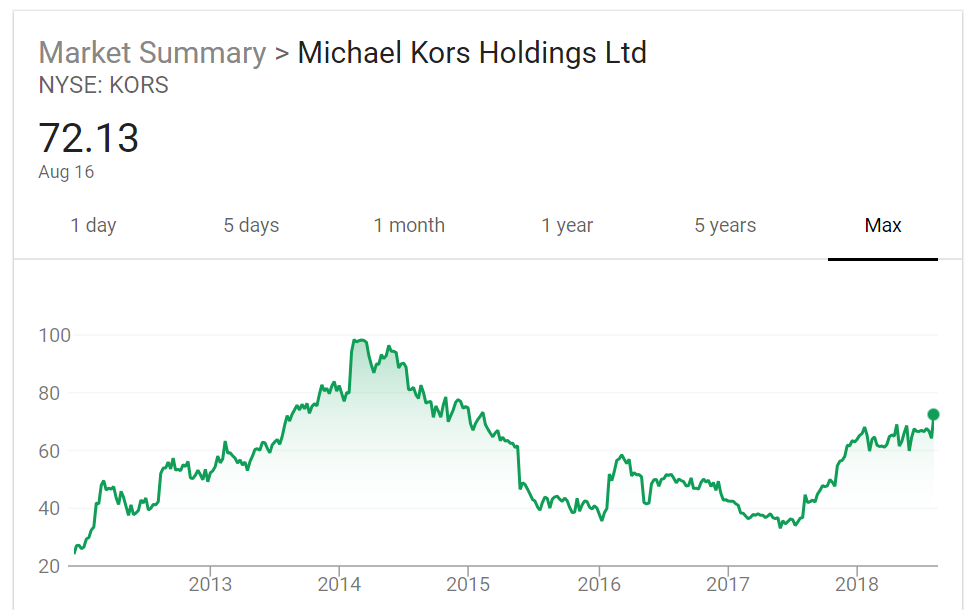
Here is a chart of Michael Kors (KORS)  stock since its late 2011 IPO. Notice the move from $20 to $100 by early 2014:

KORS-chart.png

Here is Coach stock -- now called Tapestry (TPR)-- since its IPO in 2000. In this case there were two separate astronomical run-ups, neither of which could be maintained.

TPR-chart.png

Abercrombie and Fitch (ANF) was scorching hot when I was in high school in the late 1990s:

ANF-chart.png

And one more: UnderArmour (UAA):

UAA-chart.png

There are many things these companies have in common, and not all bad actually. For instance, notice how all of these brands have survived and built sustainable multi billion dollar businesses?

But on the flip side, the stocks have been duds over long periods of time. While they have been volatile (making for plenty of trading opportunities in both directions), the reason why none of them have been good long-term buy and hold candidates is because fairly early on in their stints as public companies the brands were so popular that the stocks became massively overvalued. So even though the businesses continued to grow, the stocks turned out to be poor investments.

It has been a little while since we have seen a surging fashion brand on Wall Street (UnderArmour likely the most recent), but recent IPO Canada Goose fits the mold. Here is the chart since the 2017 IPO:

GOOS-chart.png

GOOS currently is valued at $6 billion USD, versus expected 2018 revenue of $420 million, for an enterprise to sales ratio of ~15x. Even with 20% growth in 2019, to $500 million (the current Wall Street analyst consensus estimate), the multiple is ~12x.

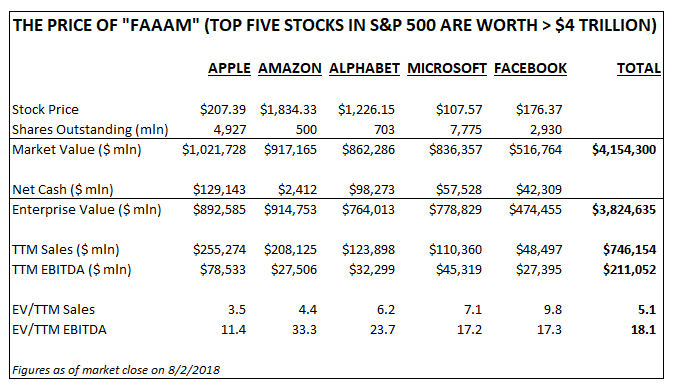
Consider what types of enterprise value-to-revenue multiples the large fashion brands currently trade for:

Tapestry 2.5x

Michael Kors 2.3x

Ralph Lauren 1.5x

Tiffany 3.9x

Nike 3.5x

UnderArmour 1.8x

There is simply no way to justify such a sky high revenue multiple for GOOS. The median revenue multiple from the group of 5 comparables above is 2.5x. So how much does GOOS need to grow over the next decade to simply justify the current stock price? The numbers come out to an 18% compounded annual growth rate from 2018 through 2028, which gets the company to roughly $2.2 billion of annual revenue:

$420M * 1.18^10 = ~$2.2 billion

Put another way, if the business grows from $420 million this year to $2.2 billion in 10 years, and the shares trade at 2.5x EV/revenue at that point in time, the stock price will go nowhere even though sales would have grown by 424%!

The only way these numbers don't work is if GOOS has somehow figured out  a way to sell clothes for far higher profit margins than the leading fashion companies in the world, which have already amassed multi-billion dollar businesses. Betting on that outcome seems ridiculous to me.

As a result, although it can be tempting to jump on highflying recent IPOs like GOOS, thinking it could be the next big thing in fashion, it is important to realize how lofty the valuations can be. And if stock prices reflect plenty of growth already in future years, the share price will not have to follow suit.

One last example, outside of the fashion space -- remember how bonkers investors went for the Shake Shack IPO back in January 2015? Take a look at how the shares have done since hitting $96 in May 2015:

SHAK-chart.png

And that is despite SHAK's revenue surging 137% from $190 million in 2015 to an expected $450 million in 2018.

GOOS buyers beware.

With Aetna Buyout Set to Close Soon, CVS Health's Flat-lined Stock Still Looks Cheap

Last October I wrote about the just-leaked CVS Health (CVS) bid for health insurance giant Aetna (AET) and tried to convey the notion that the move was about far more than just diversifying away from retail pharmacies for fear Amazon might compress margins in that industry. Interestingly, CVS's stock price was $69.05 when I published that note, and today it closed at $69.05. So almost 10 months later and all investors have earned from the shares is the not-too-shabby 3% annual dividend.

CVS reported a solid second quarter this week and is on pace to book nearly $7 of free cash flow per share in 2018 ($6.88 in my internal model), which puts the stock at 10 times free cash flow, a price normally reserved for melting ice cube businesses. And there are plenty of people who see CVS (incorrectly) as just a bricks and mortar pharmacy company destined to be disrupted by some trillion dollar market value tech darling. Others acknowledge their huge pharmacy benefits management business (Caremark), but believe the thesis that those firms are actually robbing their commercial clients blind and helping boost drug prices, when the opposite is actually true (and hence why their clients don't fire them). If both of those notions turn out to be correct, CVS will not be a good investment over the next 5 or 10 years, but I am taking the opposite view.

In fact, the story will get even better when the Aetna deal closes (CVS management indicated on their quarterly conference call this week that September or October is the most likely timeframe for closure). Essentially, CVS is building a healthcare services juggernaut, it seems to me anyway, and will be able to use a vertically integrated business model to offer consumers numerous options and generate efficiencies in an otherwise complex healthcare system. Bears on the company seem to fail to realize that a network of drugstores and in-store clinics, coupled with pharmacy plan management, assisting living and nursing home drug distribution, and insurance plans is an all-encompassing system that can be designed and integrated in such a way as to drive convenient usage from customers of all shapes and sizes, which in turn should bring down costs as scale is leveraged.

Now, there is no guarantee that the company will figure out the best way to harness this potential, but the goods news is that the stock is pricing in failure already at 10x free cash flow. Nothing positive is being considered by most investors and many of them figure the 3% dividend will be immaterial once Amazon announces 2-hour prescription fills delivered by drone starting in 2022 (that is merely speculation on my part -- no announcements have been made). However, when you look at the breadth of CVS's offerings it seems to me that this company is more than just a bricks and mortar retailer selling a commodity at a higher margin than Jeff Bezos would. It does not seem like something the tech giants could duplicate successfully.

As for the PBM side of the business, a lot has been made about pharmaceutical rebates and how they may be encouraging drug prices to remain high on a gross basis. The anti-Caremark thinking assumes that drug markers are giving the PBM rebates on drugs and those payments are juicing the profits of the PBM while patients pay huge out of pocket costs. CVS told investors this week, however, that they keep just $300 million of rebates annually, and pass the rest (roughly 97-98% of the total collected) back to their clients in one form or another (different clients choose different structures). That $300 million figure represents just 4% of the company's annual free cash flow.

Put another way, in a world where PBM plans are restructured so that no rebates are kept by the plan manager, CVS's free cash flow would drop from $6.88 to $6.59 per share. Not only is that hardly enough reason for the stock to be trading where it has been for the last year, but it is unlikely that Caremark would have to give up that $300 million at all. Rather, the PBM contracts would likely be changed to move away from rebates at all, and be underwritten in other ways such that certain folks would no longer insist rebates were the problem. Given that PBM clients are renewing their contracts in the high 90 percents every year, providers like Caremark would likely have no trouble keeping their existing business relationships, at the same underlying profit margins, even if they changed how the reimbursement of negotiated drug savings were handled.

As an investor in CVS Health, I am intrigued to see what the company can do with Aetna added to the mix. Since I don't expect their business to begin a slow decay over the next few years, I am sticking with the shares, despite them merely treading water lately, as I firmly believe the business is far more resilient and value-providing than the bears are giving it credit for. Even at 15x annual free cash flow, still a material discount to the S&P 500 index (remember when consumer staples used to trade at a premium?), CVS stock would trade north of $100 per share. Call me crazy, but I think we will get there sometime within the next 2-3 years. Add in a 3% dividend while we wait and the upside potential is impressive, especially given how negative sentiment is today (which limits further downside to some extent). 

The Price of "FAAAM" - 5 Tech Stocks Now Worth Over $4 Trillion

We hear a lot about the "FAANG" stocks (Facebook, Apple, Amazon, Netflix, Google/Alphabet) leading the S&P 500 higher in recent years, which is undeniably true, so I decided to take a look at a slightly modified version to see where valuations are within the group.

Below you will find data on "FAAAM" which I have coined to represent the top 5 most valuable companies in the S&P 500 today. By adding Microsoft in place of Netflix, we have a fivesome worth more than $4.1 trillion, or about 16.5% of the entire S&P 500 index ($25 trillion total value).

FAAAM-August2018.png

There are many conclusions investors can gleam from this group of tech stocks, and not everyone will agree. I will share a few of my views and feel free to chime in.

  • While not unprecedented, having such concentration within the dominant U.S. equity index means that near to intermediate returns for the market are largely correlated with large cap tech leaders. Given that none of the valuations are inexpensive, and Apple is probably the only one that looks to be no worse than fairly valued, investors relying on this group for future returns will need growth rates (in revenue and earnings) to continue at high rates for quite a while. It is hard to know whether this expectation is reasonable. For instance, will the size of these firms lead to slower growth by default, or are they dominant enough to continue to garner the lion share of the sector's growth overall?

  • At 18x EV/EBITDA, are the valuation of this group reasonable enough to expect that the stocks, on average, can generate double-digit annualized returns over, say, the next 5-10 years? If 20% annual growth rates in the underlying businesses persist, then the valuations are not likely too high, but that is a big open question. For instance, Amazon's revenue in 2018 is projected to reach $235 billion (current analyst consensus estimate). To keep growing at 20% per year, the company needs to find an incremental $50 billion of revenue every year, which equates to $1 billion every week! The stock is priced as though such an outcome is likely. What happens if revenue growth slows to 10%?

  • Of the five companies in "FAAAM" the only ones I would consider putting fresh money into, based on growth and valuation, would be Apple and Facebook. Apple's run to $1 trillion this week on the heels of a strong earnings report could signal the stock is topped out in the near-term. Facebook, however, trading down lately after ratcheting down growth expectations on their latest conference call, is really the only FAAAM stock that is down materially at all. While I am not exciting to buy any names in the group at current prices, they could very well have the best mix of untapped growth opportunities and less-than-exuberant investor sentiment.

Facebook Growth and Margin Warning Should Not Have Surprised Anyone

Shares of Facebook fell hard on Thursday after guiding investors to slower growth and falling operating margins going forward. Many FB bulls acted as this was a total shock (and obviously the stock was not reflecting the news either), but really this was bound to happen. In fact, FB had already warned that expenses would rise faster than revenue in 2018, to deal with all of the issues the company has been battling in the news lately. As a result, margin compression should not be surprising.

FB-1yr-july2018.png

Evidently investors also believed that even with 2 billion active users, the company could continue to grow revenue at 40%-plus. How that is possible when 2018 revenue will top $50 billion and user growth has slowed dramatically (there are only so many connected humans on the planet) is hard to understand. Perhaps investors see Amazon growing revenue 39% this past quarter and just assume that every high flying tech company can do the same. Amazon, however, is the exception, not the rule.

Below is a summary of Facebook's financial results, including some estimates I came up with for what 2018-2020 might look like. These are not all that different from the numbers I had been working off of for my last FB post earlier this year, but now that the company has publicly guided investors in that direction, it should be less of a speculation on my part.

FB-2018-2020.png

As you can see, GAAP free cash flow is unlikely to get much above $7 per share, even assuming the company can grow revenue by more than 100% over the next three years. Using my preferred measure, which includes stock-based compensation as though it was being paid out in cash to employees, free cash flow might struggle to get materially past $5 per share.

The big question for investors, then, is what multiple to put on such growth. The large cap tech leaders have been getting 30-40x multiples in recent years, but it is hard to know whether slowing growth rates (as these firms get so large) will crimp those valuations.

Facebook bulls would probably argue 30x that $7 figure is more than reasonable, and therefore would suggest a rebound to $210 per share (versus the current low 170's) is on the horizon over the next 6-12 months. Add back the company's cash hoard and maybe $225 is doable (the stock was already at $217 two days ago!).

More cautious investors might use 25x and prefer the $5 free cash flow figure, which would mean $125 per share, or $140 including FB's ~$40B of cash in the bank.

That leaves us with perhaps 20% downside and 30% upside depending on which camp you are in. Such a risk/reward does not exactly get me excited to build a position in the stock, but at least the shares are coming back to reality.

FB bulls are getting a good entry point and the bears have more reasons to watch from the sidelines. If I had to guess, I would give the bulls a slight edge and would not consider betting against the stock at current levels. In more specific terms, I think FB shares are more likely to see $200 again before breaking below $150 (the Cambridge Analytica bottom).

Are Stock Buybacks Really A Big Problem?

I read a recent article in the Wall Street Journal entitled The Real Problem with Stock Buybacks (WSJ paywall)  which spent a lot of time discussing multiple pitfalls of stock buybacks and touched on some lawmakers in Washington who would like to limit, or completely outlaw, the practice. To say I was dumbstruck by the piece would almost be an understatement.

Let me go through some of the article's points.

First, the idea that the SEC should have the ability to limit corporate buybacks, if in its judgment, carrying them out would hurt workers or is not in the long-term best interest of the company.

To be fair, the authors disagreed with this idea. They were simply bringing to readers' attention that it was out there. Public companies are owned by shareholders, and those shareholders are represented by the board of directors (whom they vote for). The CEO serves the board on behalf of those shareholders, though admittedly this is a problem when the CEO is also Chairman. As such, the government really has no place to tell boards how to allocate profits from the business that belong to the shareholders. This should be obvious, but evidently it is not to some. The entire activist investor concept is based on the idea that too few times investors pressure boards to act more strongly on their behalf. The system works, and should stay as-is.

The authors, however, do make an assertion of their own that I fail to understand. They claim that the real problem with stock buybacks is that they transfer wealth from shareholders to executives. More specifically, they state:

"Researchers have shown that executives opportunistically use repurchases to shrink the share count and thereby trigger earnings-per-share-based bonuses. Executives also use buybacks to create temporary additional demand for shares, nudging up the short-term stock price as executives unload equity. Finally, managers who know the stock is cheap use open-market repurchases to secretly buy back shares, boosting the value of their long-term equity. Although continuing public shareholders also profit from this indirect insider trading, selling public shareholders lose by a greater amount, reducing investor returns in aggregate."

This paragraph makes no sense, and of course, the authors (a couple of Harvard professors unlikely to have much real world financial market experience) offer up zero data or evidence to support their claims.

So let's address their claims one sentence at a time:

"Researchers have shown that executives opportunistically use repurchases to shrink the share count and thereby trigger earnings-per-share-based bonuses."

This statement implies that a shrinking share count and earnings per share growth are bad, or at least suboptimal. Why? The reason executive bonuses are based, in many cases, on earnings per share, is because company boards are working for the shareholders, and those shareholders want to see their stock prices rise over time. Since earnings per share are the single most important factor in establishing market prices for public stock, it is entirely rational to reward executives when they grow earnings.

"Executives also use buybacks to create temporary additional demand for shares, nudging up the short-term stock price as executives unload equity."

Insiders are notorious for owning very little of their own company's stock. Aside from founder/CEO situations, most CEOs own less than 1% of their company's stock. In fact, many boards are now requiring executives to own more company stock, in order to align their interests with the other shareholders even more. As such, the idea that executives unload stock at alarming rates, and that such actions form the bulk of their compensation, is not close to the truth in aggregate.

In addition, if the stock price is being supported, in part, by stock buybacks, does that not help all investors equally? Just as insiders can sell shares at these supposed elevated prices, can't every other shareholder do the same? At that case, how are the executives benefiting more than other shareholders?

"Finally, managers who know the stock is cheap use open-market repurchases to secretly buy back shares, boosting the value of their long-term equity."

This one makes no sense. Insiders buyback stock when it's cheap?! Oh no, what a calamity! In reality, company's have a poor record of buying back stock when it is cheap and often overpay for shares. Every investor in the world would be ecstatic if managers bought back stock only when it was cheap.

And how are buybacks a secret? Boards disclose buyback authorizations in advance and every quarter the company will announce how many shares they bought and at what price. It is true that such data is between 2 and 14 weeks delayed before it is published, but that hardly matters.

Again, the authors imply that increasing the value of stock is bad for investors, unless those investors are company insiders. In those cases they are getting away with something nefarious. In reality, each shareholder benefits from stock buybacks in proportion to their ownership level (i.e. equally).

"Although continuing public shareholders also profit from this indirect insider trading, selling public shareholders lose by a greater amount, reducing investor returns in aggregate."

Huh? Buying back cheap stock reduces investor returns and hurts public shareholders? I can only assume that the authors simply do not understand as well as they should what exactly buybacks accomplish and what good capital allocation looks like. It is a shame that the Wall Street Journal would publish an opinion so clearly misguided.

As Large Cap Tech Continues to Lead, Valuations Begin to Stretch

There is no doubt that the tech sector is where investors will find earnings growth in today's market, and many money managers are willing to pay full valuations to stack their portfolios with most, if not all, of the big name innovators.

Even though it means sometimes missing out on huge share price run-ups, I tend to buy these companies when they miss a quarter, during a market drop, or any other time when the valuations look "reasonable" (knowing full well they rarely will be cheap on an absolute basis). There was a great opportunity in Amazon (AMZN) in 2014, for instance. Last year, Alphabet (GOOG) in the low 900's looked like a good bet. Facebook (FB) briefly dipped below $150 earlier this year during a string of negative press, though I regrettably didn't pull the trigger on that one.

In fact, massive buying of these leading tech companies has resulted in the sector comprising 26% of the S&P 500 index, a level not seen since the peak of the dot-com bubble in March 2000 when tech accounted for a stunning 34% of its value. For comparison, financial stocks peaked at 20% of the S&P in 2007, before the housing collapse and no other sector has ever reached the 20% level. Amazingly, the five most valuable stocks in the index today are tech names:

Tech-Dom-SPX500.png

I have previously written about Amazon's recent share price ascent and how its price to revenue multiple is getting quite rich -- which has not stopped the stock from jumping 20% since -- and today I want to dig into Alphabet as well. While that stock around $900 last year looked like a solid GARP ("growth at a reasonable price") play last year, as it approaches $1,200 today I am a seller.

A big issue with these tech companies is their tendency to dole more and more stock, instead of cash, to employees as part of compensation packages. This allows them to produce inflated cash flow numbers, which investors/analysts then use to justify their investments/recommendations. When I value them, conversely, I use an adjusted free cash flow metric that subtracts from reported free cash flow all stock-based compensation. To me, this adjusted number more fully reflects how much cash the business is actually generating.

Below are some data points for Alphabet, from 2015 through 2018:

GOOG-Valuation.png

As you can see, stock-based compensation at Alphabet equates to roughly one-third of free cash flow. Therefore, when the investing community cites strong operating cash flow, or impressive free cash flow, they are ignoring billions in stock comp. To give you a feel for the magnitude of these numbers, my internal estimates indicate Alphabet's stock comp will come within striking distance of $10 billion in 2018. It is more than just rounding error.

Despite strong sales growth (the consensus view calls for 20% per year, on average, for 2018 and 2019), investors are paying quite a big price for the stock at current prices. At $1,180 each, GOOG fetches just shy of 50x times my 2018 free cash flow estimate, less stock-based comp, of $25 per share.

As an alternative, using EV/EBITDA, which includes stock comp and gives the company full credit for their large net cash position, the multiple is an unattractive 18x (using my 2018 EBITDA estimate of $41 billion).

While there will always be investors willing to pay up for growth, the main thesis in recent years ("the stocks are not expensive") might be harder to justify now. As a result, I think it is more important than ever to be opportunistic and focus on taking advantage of near-term pullbacks, rather than buying the biggest U.S. companies indiscriminately just because they have performed so well in recent years.

Full Disclosure: I have been selling shares of GOOG this week

Biglari Holdings: Severely Mispriced Yet Again

I have not written about Biglari Holdings (BH) on this site since late 2014, but that does not mean the company has fallen off of my radar. While BH was once a prime long-term buy and hold candidate, it has become obvious over the years that the controlling shareholder and CEO, Sardar Biglari, not only prefers running an unconventional public company, but often does so at the detriment to its shareholders.

For those unfamiliar, the bulk of BH's assets (and value) come from a 100% ownership of Steak N Shake and a large stake in two hedge funds run by Mr. Biglari, which are mostly comprised of shares in BH and Cracker Barrel (CBRL). The stock is volatile, sometimes trading quite low and other times approximating fair value for an unfocused conglomerate with little investor recourse.

Given a few too many unconventional moves (buying BH shares on the open market via the hedge funds and holding them for investment, as opposed to buying them at the corporate level and retiring the shares), I have largely been interested in BH in recent years as a trading vehicle -- not a long-term investment -- buying when the stock is clearly mispriced and selling when it approaches a more reasonable level.

Such an opportunity has once again presented itself after a late April move that resulted in shares of BH being divided into dual classes of stock; A shares and B shares, the former allowing Mr. Biglari to maintain control of the company, with the latter having no voting rights and serving as potential M&A currency.

Prior to the dual class issuance, BH stock was trading around $420 per share. Upon issuance of the new class A shares, the B shares should have fallen in price by roughly one-third according to the exchange ratio, which would have put them in the $280 range. And for a few days that ratio seemed to hold, but then a free fall began. Today BH "class B" fetches around $200 per share (I am focused on the non voting stock because the voting rights are meaningless considering that the CEO controls more than 50% of the votes).

So just how mispriced is this $200 piece of paper? Well, the total equity value at current prices is roughly $630 million. If we ignore the operating businesses (more than $800 million of annual revenue and by my guess, maybe $25M-$30M of EBITDA this year), BH shareholders own (indirectly via ownership of hedge fund LP interests) nearly 4.4 million shares of Cracker Barrel and nearly 1.3 million class B equivalent shares of Biglari Holdings. Since both are publicly traded, we can quickly assign a value to each, which cumulatively comes out to more than $950 million, or $305 per BH class B share. And yet BH class B's trade for just $200 apiece. As you can see, something is off here.

Now, there are reasons why BH will unlikely ever trade for "full price" based on its assets. After all, many investors would immediately balk at a public stock that owns some companies outright, minority stakes in others through hedge funds, and chooses to buy up but not retire its own shares in the open market. There are other issues too, such as a large unrealized gain on the Cracker Barrel shares, which were acquired for less than $50 each (current price $160), and over $200 million of Steak N Shake debt outstanding.

Still, even if the negatives surrounding BH would result in the operating businesses being valued closer to zero than a more typical $25-$50 per class B share (which I believe they would fetch with a different owner), BH remains mispriced. If we exclude the BH shares owned by the company itself, the equity is valued at about $370 million. To put that into perspective, the Cracker Barrel stake alone is worth $700 million at the current market price, so maybe $600 million net of tax.

At a certain price it is hard to argue against taking a long position in a company that often sees its share price get out of tune with reality due to its unusual composition and low float (due to being small to begin with and having a majority owner). Count me as one who does not think the B shares should trade materially below the $300 level. The recent dual class restructuring has given the small investor a profit-making opportunity.

Full Disclosure: Long shares of BH class B at the time of writing, but positions may change at any time

Sports Betting Will Help Many Gaming Companies On The Margins, But Impact Will Likely Be Tempered

Some investors might have thought that last week's Supreme Court decision that paves the way for legal sports betting in all 50 states would have resulted in skyrocketing stock prices of the largest perceived beneficiaries. And yet, the market reaction thus far has been fairly tame.

Consider Penn National Gaming (PENN), whose pending merger with Pinnacle Entertainment (PNK) will make it the largest regional casino operator in the United States. It stands to reason that from a customer destination perspective, they should benefit immensely from sports bets being taken outside of Nevada. And yet, PENN shares have moved up only marginally (less than 5%) since the ruling was announced:

PENN-chart.png

So why isn't Penn stock soaring? Won't there be millions of bets placed at their casino resorts annually once the infrastructure is put into place? Probably, but it is important to keep in mind how much revenue these bets will likely generate for the sportsbooks (hint: it might be less than one thinks).

Americans wager about $5 billion in Nevada sportsbooks each year. It is not crazy to think that the market will be increased by many multiples of that if a dozen or two dozen states take steps to accept bets. With over 200 million Americans of betting age, it is not crazy to think the market could swell by a factor of 10. Annual wagers of $50 billion in total equates to about $200 from each and every American age 21 and over.

However, we must keep in mind that the $50 billion is a gross figure (the "handle" for the betting inclined). In Nevada, the historical hold percentage is around 5%, which is the amount the sportsbooks net after paying out winning bets. As a result, $50 billion of gross bets will generate revenue of just $2.5 billion. Still a hefty sum, but there's more to consider...

Many states, like New Jersey (which spearheaded the lawsuit that set this entire process in motion), are chomping at the bit to allow sports betting because they see it as a revenue generator. States typically tax casinos heavily in exchange for granting licenses to operate facilities that many constituents would prefer not exist. Those taxes are usually assessed on adjusted gross proceeds (total bets placed less winnings paid out), which eat into casino profit margins quickly. According to this article, while New Jersey taxes casino at just over 9% (among the lowest), most neighboring states charge far more, with New York at 31-41% and Pennsylvania at 16-55%.

So let's imagine that state legislators decide to tax sports betting revenue at an average of 30%. Now we have gone from $50 billion in "handle" to $2.5 billion of "pre-tax revenue" to just $1.75 billion of "after-tax revenue." With more than 500 casinos in the country (a Penn/Pinnacle combination would own 40 alone), each stands to generate some incremental revenue ($3.5 million per year, on average), but it will by no means be life-altering for shareholders. Perhaps that explains why Penn National stock is up only a few percentage points since the news hit.

Now, this of course only considers actual gaming revenue from the bets themselves. Resort operators will surely try their best to attract customers to visit frequently and spend some money on food, drinks, and perhaps some slot or table game play while they are there. The tricky part about that strategy, however, is that technology is likely going to play a huge role in nationwide sports betting.

Movie theaters and restaurants are already trying to figure out how to coax customers out to their properties when Netflix and food delivery services are just a few clicks away. The same will be true for the sports betting industry. MGM already has a mobile app for Nevada residents that allows in-state players to place bets from home (or anywhere else). Such capabilities will surely expand to other states now, so why not just watch from your couch and bet on your smartphone?

What is probably a slam dunk, though, is that engagement with sports teams should increase. That is good news for Disney (DIS), whose stock has firmed up lately despite worries about cord cutting and ESPN subscriber losses. ESPN viewership should increase (as can ad rates) as regular games have more importance to the average fan who might throw down twenty bucks on the outcome.

With engagement set to rise, there will be more money attached to these teams and franchise values should continue to rise, perhaps even faster than currently (if that is possible). In addition to Disney, stocks like Madison Square Garden (MSG), which owns the Knicks (NBA) and Rangers (NHL), could see increased investor interest.

All in all, this is an interesting time to be sports fan and market watcher. While there will be billions of dollars generated from legalized sports betting, it is likely that with so many players in the industry set to split the pot, outsized winners are less likely in my view. As a result, there might be very few pure plays from a stock market perspective. Instead, take a company like DIS or PENN or MSG, all of which have dominant franchises already, and assume that sport betting will help them at the margins increase shareholder value over the long term.

Charter and Comcast Shares Fall on Hard Times, Look Ripe for Rebound

It has been about five months since I outlined the valuation disconnect between the two leading consumer telecommunications providers in the United States in a post entitled Is the Enthusiasm for Charter Communications Getting Overdone? Charter (CHTR) and Comcast (CMCSA) together provide nearly half of the country's households with cable, broadband, and phone service. A lot has happened since then, so I thought it would be interesting to revisit the situation.

It turns out that my post last August roughly marked the short-term peak, and shares have fallen about 30% since:

CHTR-followup.png

Whereas the shares near $400 seemed very overpriced compared with the likes of Comcast (11.5x EV/EBITDA vs 8.6x), they now appear closer to fair value at around 8.8x my 2018 EBITDA estimate. Comcast has also hit a rough patch in terms of stock performance, on the heels of its bid for UK's Sky Plc, which would further entrench them into the pay television world. While CHTR has fallen 30%, CMCSA has dropped 20%, and now fetches $32 per share, or just 7x my estimate of 2018 EBITDA.

In my mind, Comcast looks very cheap and Charter appears to be reasonably priced, without factoring in any upside they could see from increasing prices on broadband services (they are priced well below Comcast currently), or from their upcoming cellular phone service offering, which promises to look very similar to Comcast's recently launched and fast-growing Xfinity Mobile service.

My wife recently switched from Sprint to Xfinity Mobile and is paying $12 for every 1 GB of data usage, with no additional charges other than the phone payment itself. Having switched to Google Fi from Sprint earlier this year, I had planned on adding her to my plan upon the termination of her contract, but Xfinity Mobile is actually an even better deal because Google Fi pairs a $15 plan charge along with a $10 per GB data rate. You can add family members for just $10 more )rather than another $15), but it would have cost $20 to add my wife to my plan, whereas Xfinity charges just $12.

With such a compelling price (using Verizon's network), it is no wonder that Comcast last quarter added more post-paid mobile subscribers than AT&T and Verizon combined. Charter is set to launch a similar service later this year, also using Verizon's network (pricing not yet available), and I would suspect they will see quite a bit of traction at that point. In fact, with Comcast and Charter in attack mode, it is easier to see why Spring and T-Mobile might think they can get regulators to bless their merger. The big cable companies, along with Google, are truly strong competitors in the marketplace.

And there is the constant merger talk involving Charter, whether they be the buyer or the target. Talks with Verizon and Sprint supposedly did not progress too far last year, but as a large triple play operator without a dedicated mobile or content business, it is not hard to understand why Charter could continue to be a player in the M&A market (thus far they have simply rolled up a bunch of regional cable companies).

Simply put, Comcast would fetch $40 per share if it just traded at 15 times annual free cash flow, and they have a fairly diverse business as it stands, even without buying Sky. Investors are worried about them overpaying in the M&A world, but the current price seems to account for those fears already. And with Charter stock now trading at a fair price, the risk-reward appears very favorable given that they have optionality in terms of their mobile offering, broadband pricing, and continued M&A activity.  For the intermediate to longer term, I do not see material downside for either stock, and 20% gains would not surprise me.

Investors should also take a look at T-Mobile, now that they are going to try to get a Sprint deal done officially. The stock initially bounced well above $60 on the news, but has faded back into the mid 50's. They are performing best in the mobile world right now and the stock is not expensive. It looks like it could be a case of "heads, we win" (continued strong operating performance going at it alone, and "tails we win big" (the deal with Sprint has massive synergies) situation.

Full Disclosure: Certain clients of PCM were long CHTR, GOOG, TMUS, VZ, and Sprint debt at the time of writing, but positions may change at any time without notice

After Post-Election Euphoria, Big Banks Start To Look More Attractive After Sideways Action

I was underweighted bank stocks heading into the 2016 presidential election and proceeded to watch as they soared immediately following. I didn't jump on the bandwagon because although the reasoning was solid (less regulation, higher interest rates) the stocks seemed to get way ahead of the actual fundamentals (in terms of timing). Below is a chart of the KBW bank index during that time:      

KBW.png

As is often the case when upward moves appear a bit too steep, the stock have since leveled off and moved sideways for the last year or so. I have gotten more interested lately, not only because valuations are more attractive, but because the regulation relief is indeed occurring now and more normal levels of financial market volatility bode well for banks with exposure to the investment side of the business.

To figure out the best companies to focus on, I decided to see what the valuations today we saying about the profitability of the large banks, relative to the return on equity metrics posted for the first quarter, which is the first period where tax rates have come down to the new, lower level.

Oftentimes investors simply look at price-to-book ratios (the most common valuation metric for banks) and assume that the highest ones are fully valued and the lowest are most attractive. While this may be true sometimes, I am more interested in how the market is valuing these banks relative to their profitability outlook. To judge on that level, I prefer to see where price-to-book ratios are, versus where I think they should be based on each bank's fundamentals. To do so, I look at return on equity and look for relative mismatches in the data.

Below are current metrics for six of the largest U.S. banks:    

big6banks-april2018.png

If we only look at price-to-book, we would want to buy Citigroup and short JP Morgan. But since JPM is a best better managed bank, and earns 50% more on its equity (15% vs 10%), those two banks should not trade at similar P/B ratios.

To balance out the data, I calculate what I call "Implied P/E" which tells us what valuation the market is pricing in, assuming current ROE's remain constant. On this metric, we see that JPM is trading at 10.9x earnings (if they earn 15 cents for every $1 of equity, a P/E of 10 would equate to a price-to-book ratio of 1.50x). Similarly, Citi trades at 9.8x implied earnings.

All of the sudden, JPM doesn't look as expensive relative to Citi. The price-to-book premium is 67%, but since their returns are different, the premium us really more like 11%. Framed that way, investors who might have balked before could very well decide they prefer JPM at ~11x earnings, to Citi at ~10x.

The chart above resulted in me being less interested in WFC, even though their recent troubles on the surface appeared to provide long-term investors a good entry point for the stock. Of the entire list, I would say GS and JPM are the best-run companies. To see GS at the top of the list on my preferred "implied P/E" metric really got my attention. Their long-term track record as a public company (since 1999) is quite impressive and as a result, I am quite intrigued by the stock at current prices.

Full Disclosure: Long shares of Goldman Sachs at the time of writing, but positions may change at any time without further notice.